Visualizes GitHub contributions as an interactive 3D city, free for all.


Product memo
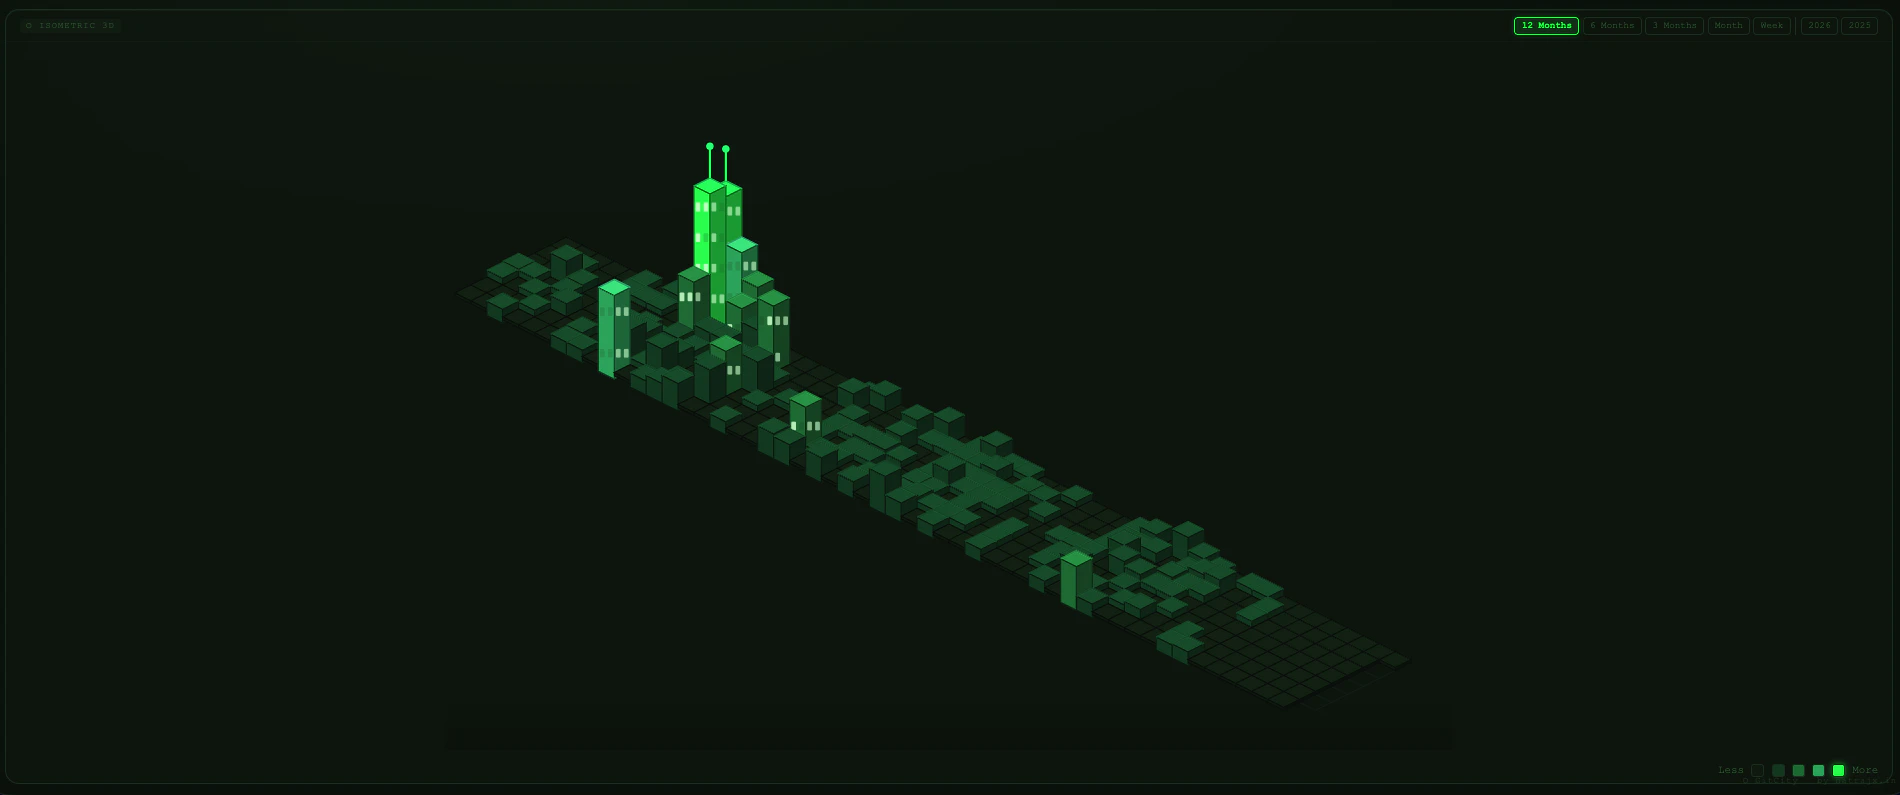
GitCity gives developers a unique, gamified way to visualize their coding activity. It transforms commit history into an interactive 3D city, offering a novel alternative to standard contribution graphs. The open-source nature and embeddable SVG output lower adoption barriers, making it ideal for personal portfolios and READMEs.
For who
Developers visualizing GitHub contributions
Solves what
Visualizing GitHub commit history as an interactive 3D city
- 3D isometric city skyline
- Driveable city simulation
- Embeddable SVG for READMEs
In their own words
Visualize Your GitHub Contributions as a 3D City
Transform your GitHub commit history into a stunning isometric city skyline. Every day you code, a building grows. Drive through your city, switch themes, and embed your skyline in any README — free and open-source.
Commercial cues
Model
free only
Free tier
Yes
Trial
No
Pricing Strategy
GitCity offers a free tier; paid plan details are not publicly priced.
- • Free and open-source model encourages widespread adoption and community contributions.
- • Unlimited contributions remove usage friction for all developers.
- • Voluntary sponsorship keeps the core product free.
Operator context
Team
Indie / lean
Founded
Apr 2026
Platform
Web app
Audience
Developers
Public footprint
Builder Strategy
- Strategy Type
- Wedge Expand
- Stage
- Bootstrapped Lean
- Effort
- Solo Buildable
About GitCity Expand
GitCity offers developers a creative way to display their GitHub contributions, turning commit history into an interactive 3D city. It integrates directly with GitHub data to build a driveable city simulation where daily code activity grows buildings.
This open-source tool provides customizable themes and embeddable SVG output, making it easy for users to showcase their coding journey on personal portfolios or README files. Its unique visualization approach serves as a alternative to traditional contribution graphs.