
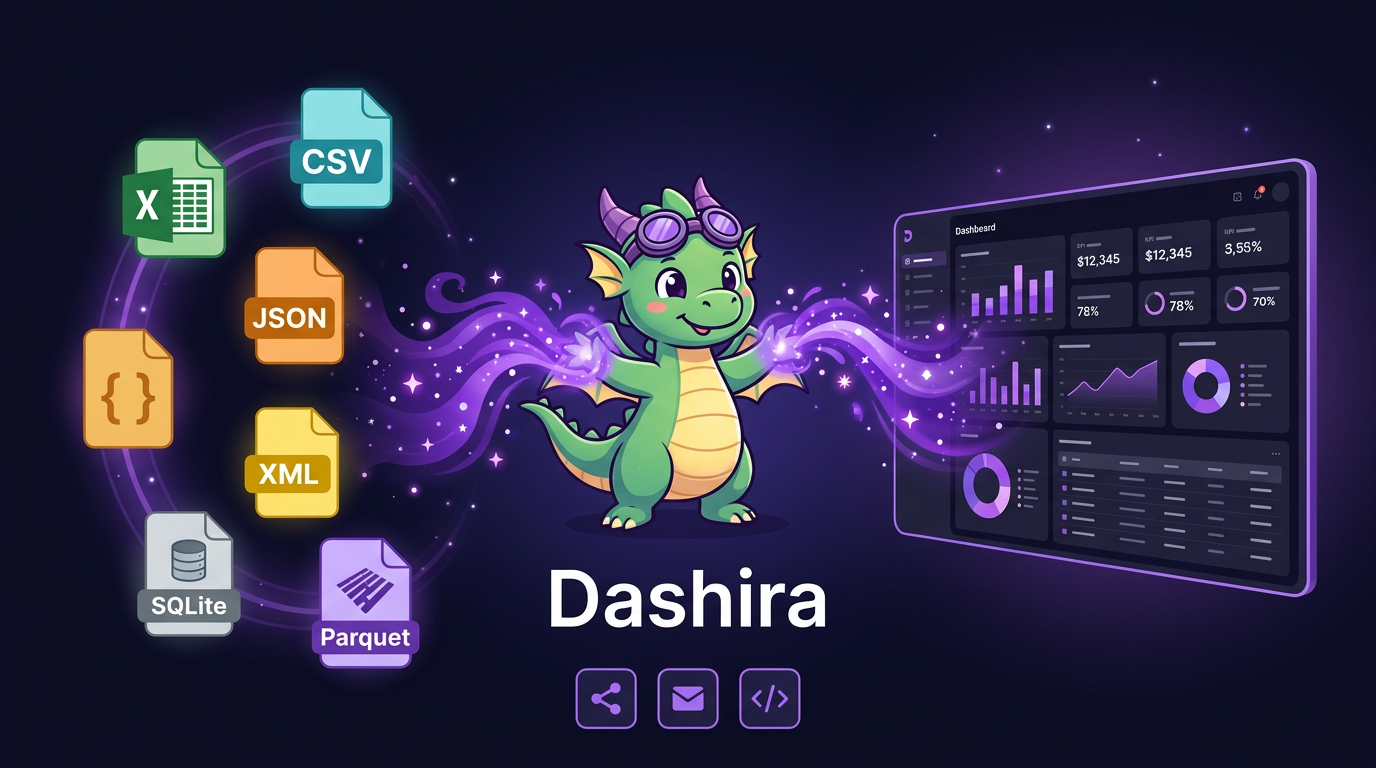
Transforms data files into interactive, shareable dashboards with APIs.
Product memo
Data analysts, teams, and consultants use Dashira to turn raw data files into interactive dashboards. It provides a rapid, no-code way to visualize structured data, generating dashboards with built-in REST and GraphQL APIs. This approach simplifies sharing and integration, serving both internal reporting and client presentations.
For who
Data analysts, teams, and consultants
Solves what
Transforms data files into interactive, shareable dashboards with APIs.
- Data file upload
- Auto-generated dashboards
- REST & GraphQL APIs
In their own words
Turn Any Excel, CSV, JSON or Data File
Into an Interactive Dashboard
Upload your data. Get a beautiful, shareable dashboard with built-in APIs. Free to start.
Commercial cues
Model
hybrid
Free tier
Yes
Trial
Available
Pricing Strategy
- • A freemium tier allows new users to test the dashboard builder.
- • Tiered plans gate advanced features like API access and custom branding.
Operator context
Operating setup
Founded
Mar 2026
Platform
Web app
Audience
Creators
Payments
Stripe
Detected via TrustMRR
Social footprint
Builder Strategy
- Strategy Type
- Niche Specialist
- Stage
- Vc Growth
- Effort
- Solo Buildable
About Dashira Expand
Dashira provides data analysts, teams, and consultants with a no-code platform to quickly visualize structured data. It accepts common file types like CSV, Excel, and JSON, generating interactive dashboards that are ready for sharing.
A key differentiator is the inclusion of built-in REST and GraphQL APIs, which simplifies data integration and distribution. This makes Dashira a practical choice for both internal reporting and client-facing presentations, allowing users to focus on insights rather than development effort.
The product’s positioning targets users who need rapid deployment and flexible sharing options for their data visualizations.