
Turns spreadsheets into interactive dashboards instantly, no code or signup needed.

Product memo
Data to Visuals serves spreadsheet users who need fast data insights but lack the budget or technical skills for complex business intelligence platforms. It provides a free, in-browser tool for building charts and dashboards from CSV or Excel files. This approach prioritizes user privacy and ease of use, making it an accessible option for quick reporting and analysis without any sign-up friction.
For who
Spreadsheet users needing fast data insights
Solves what
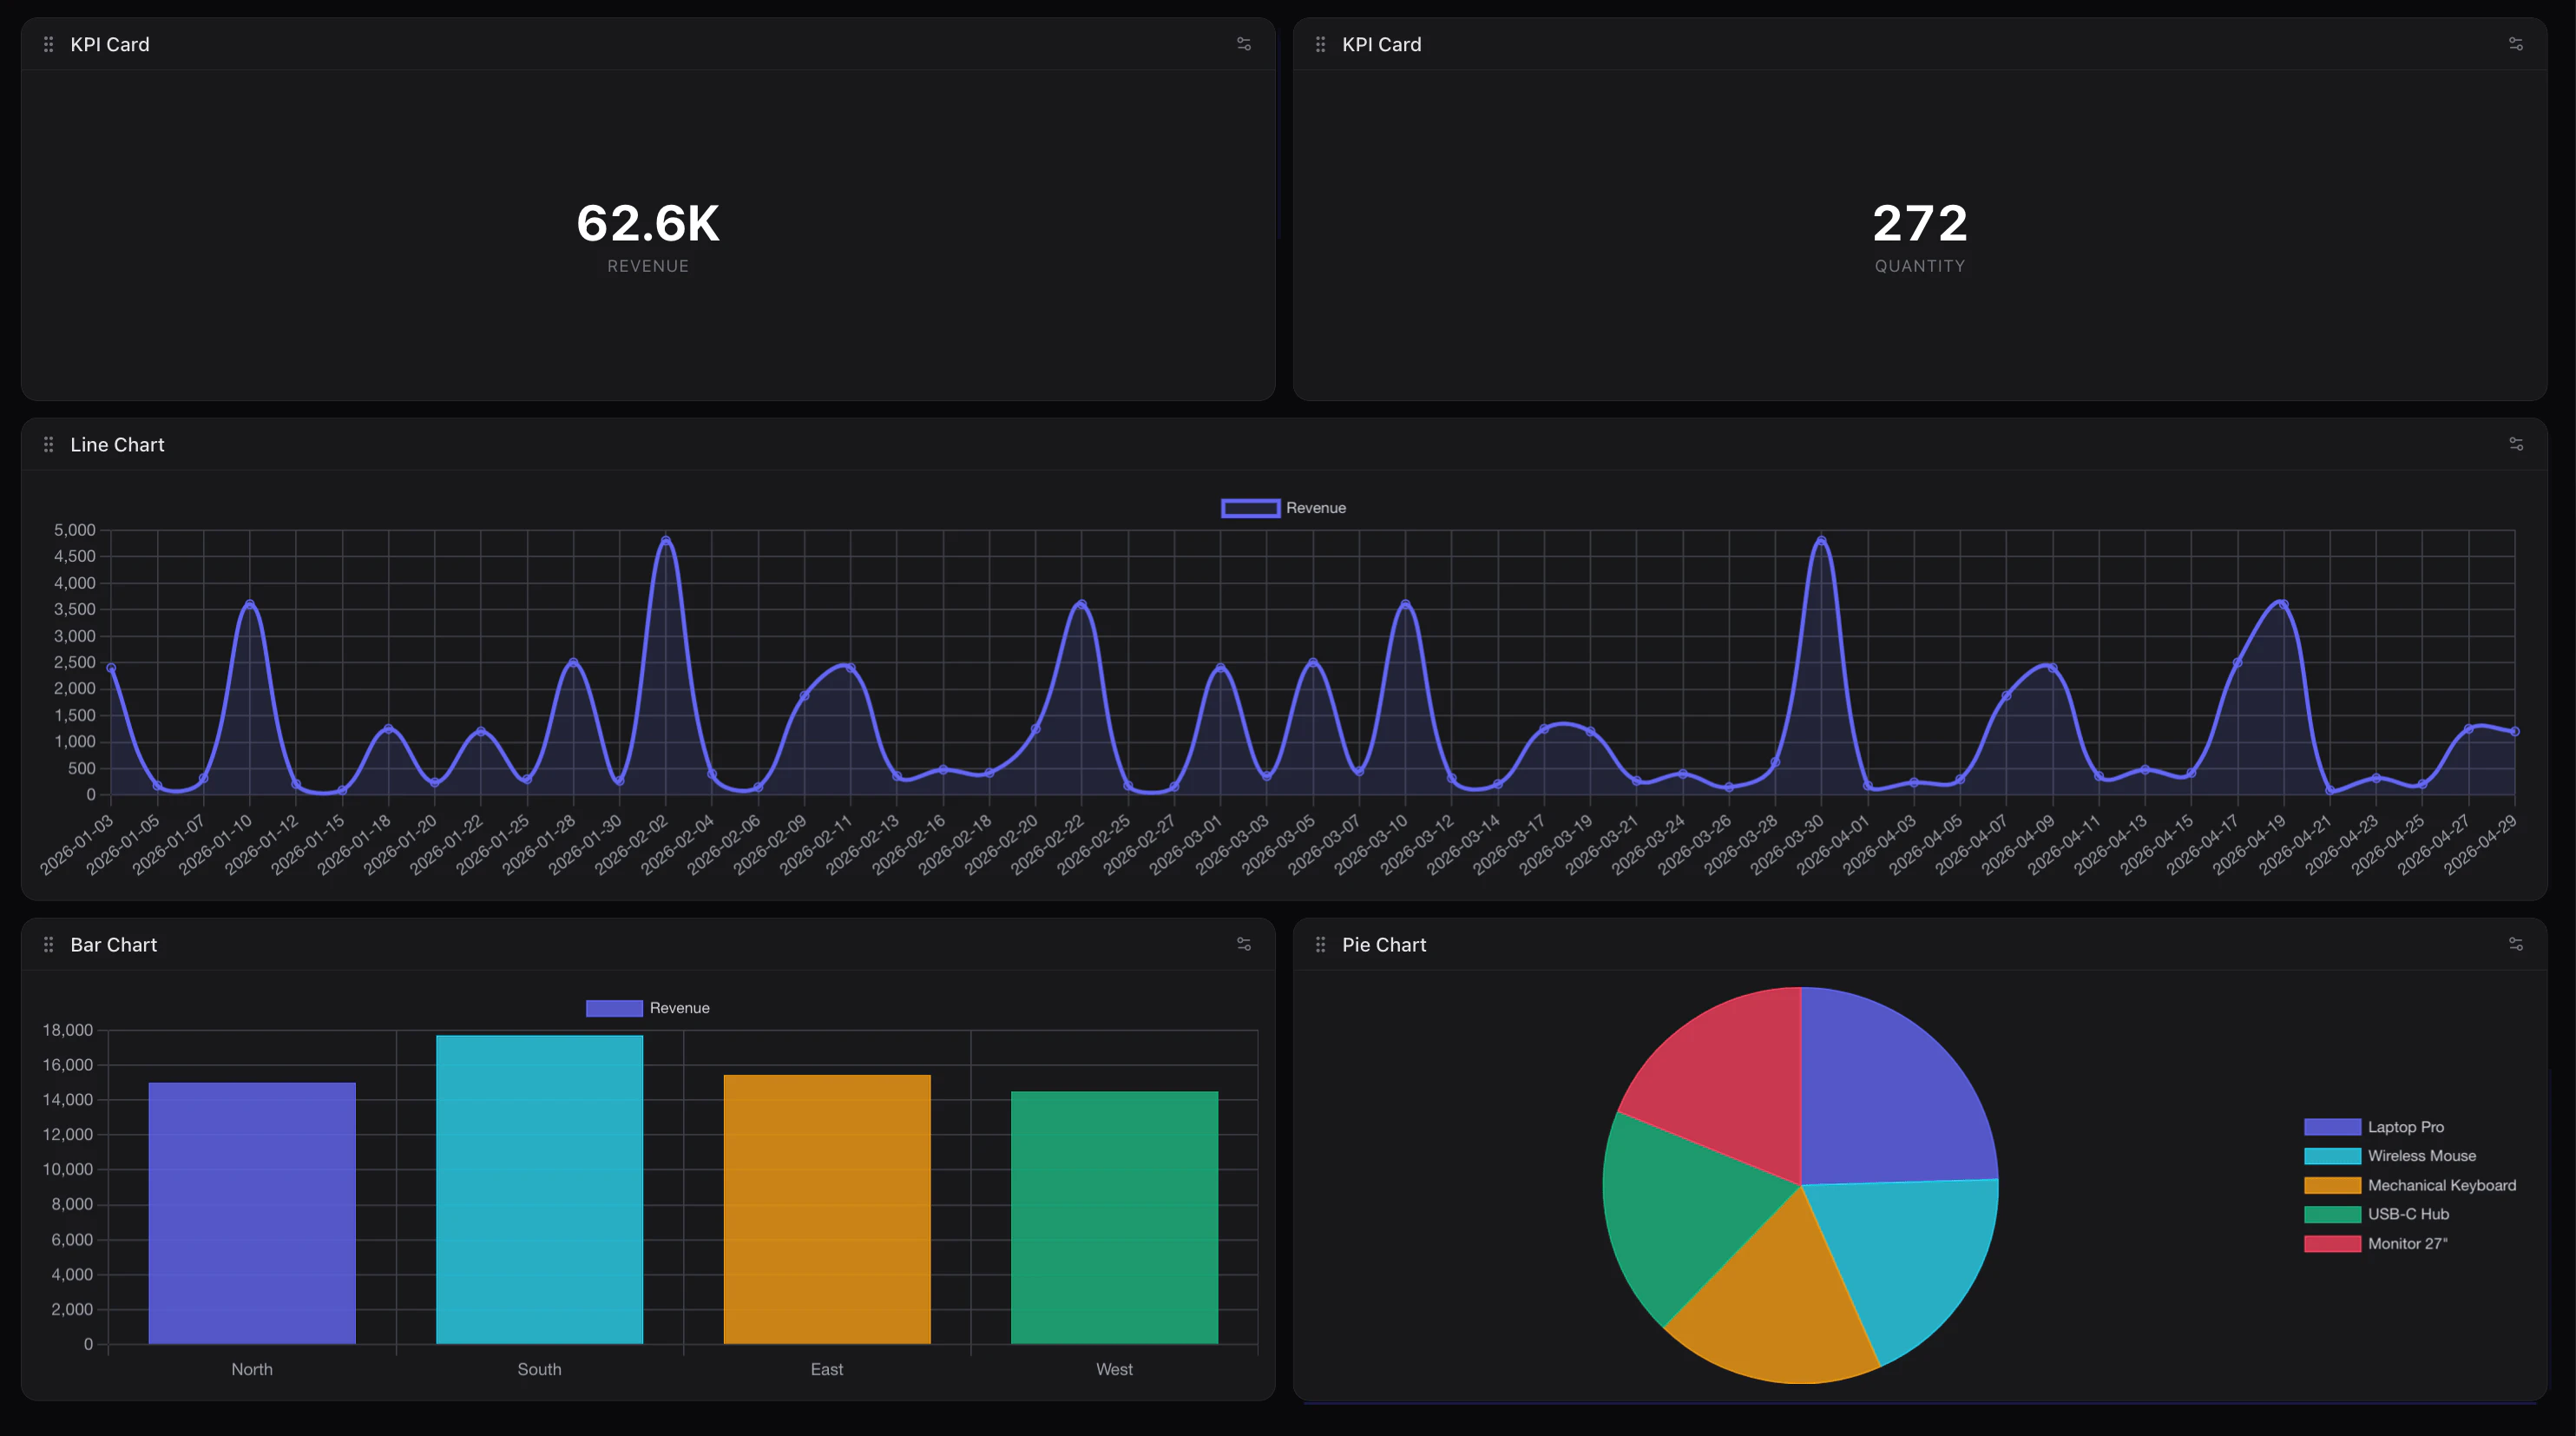
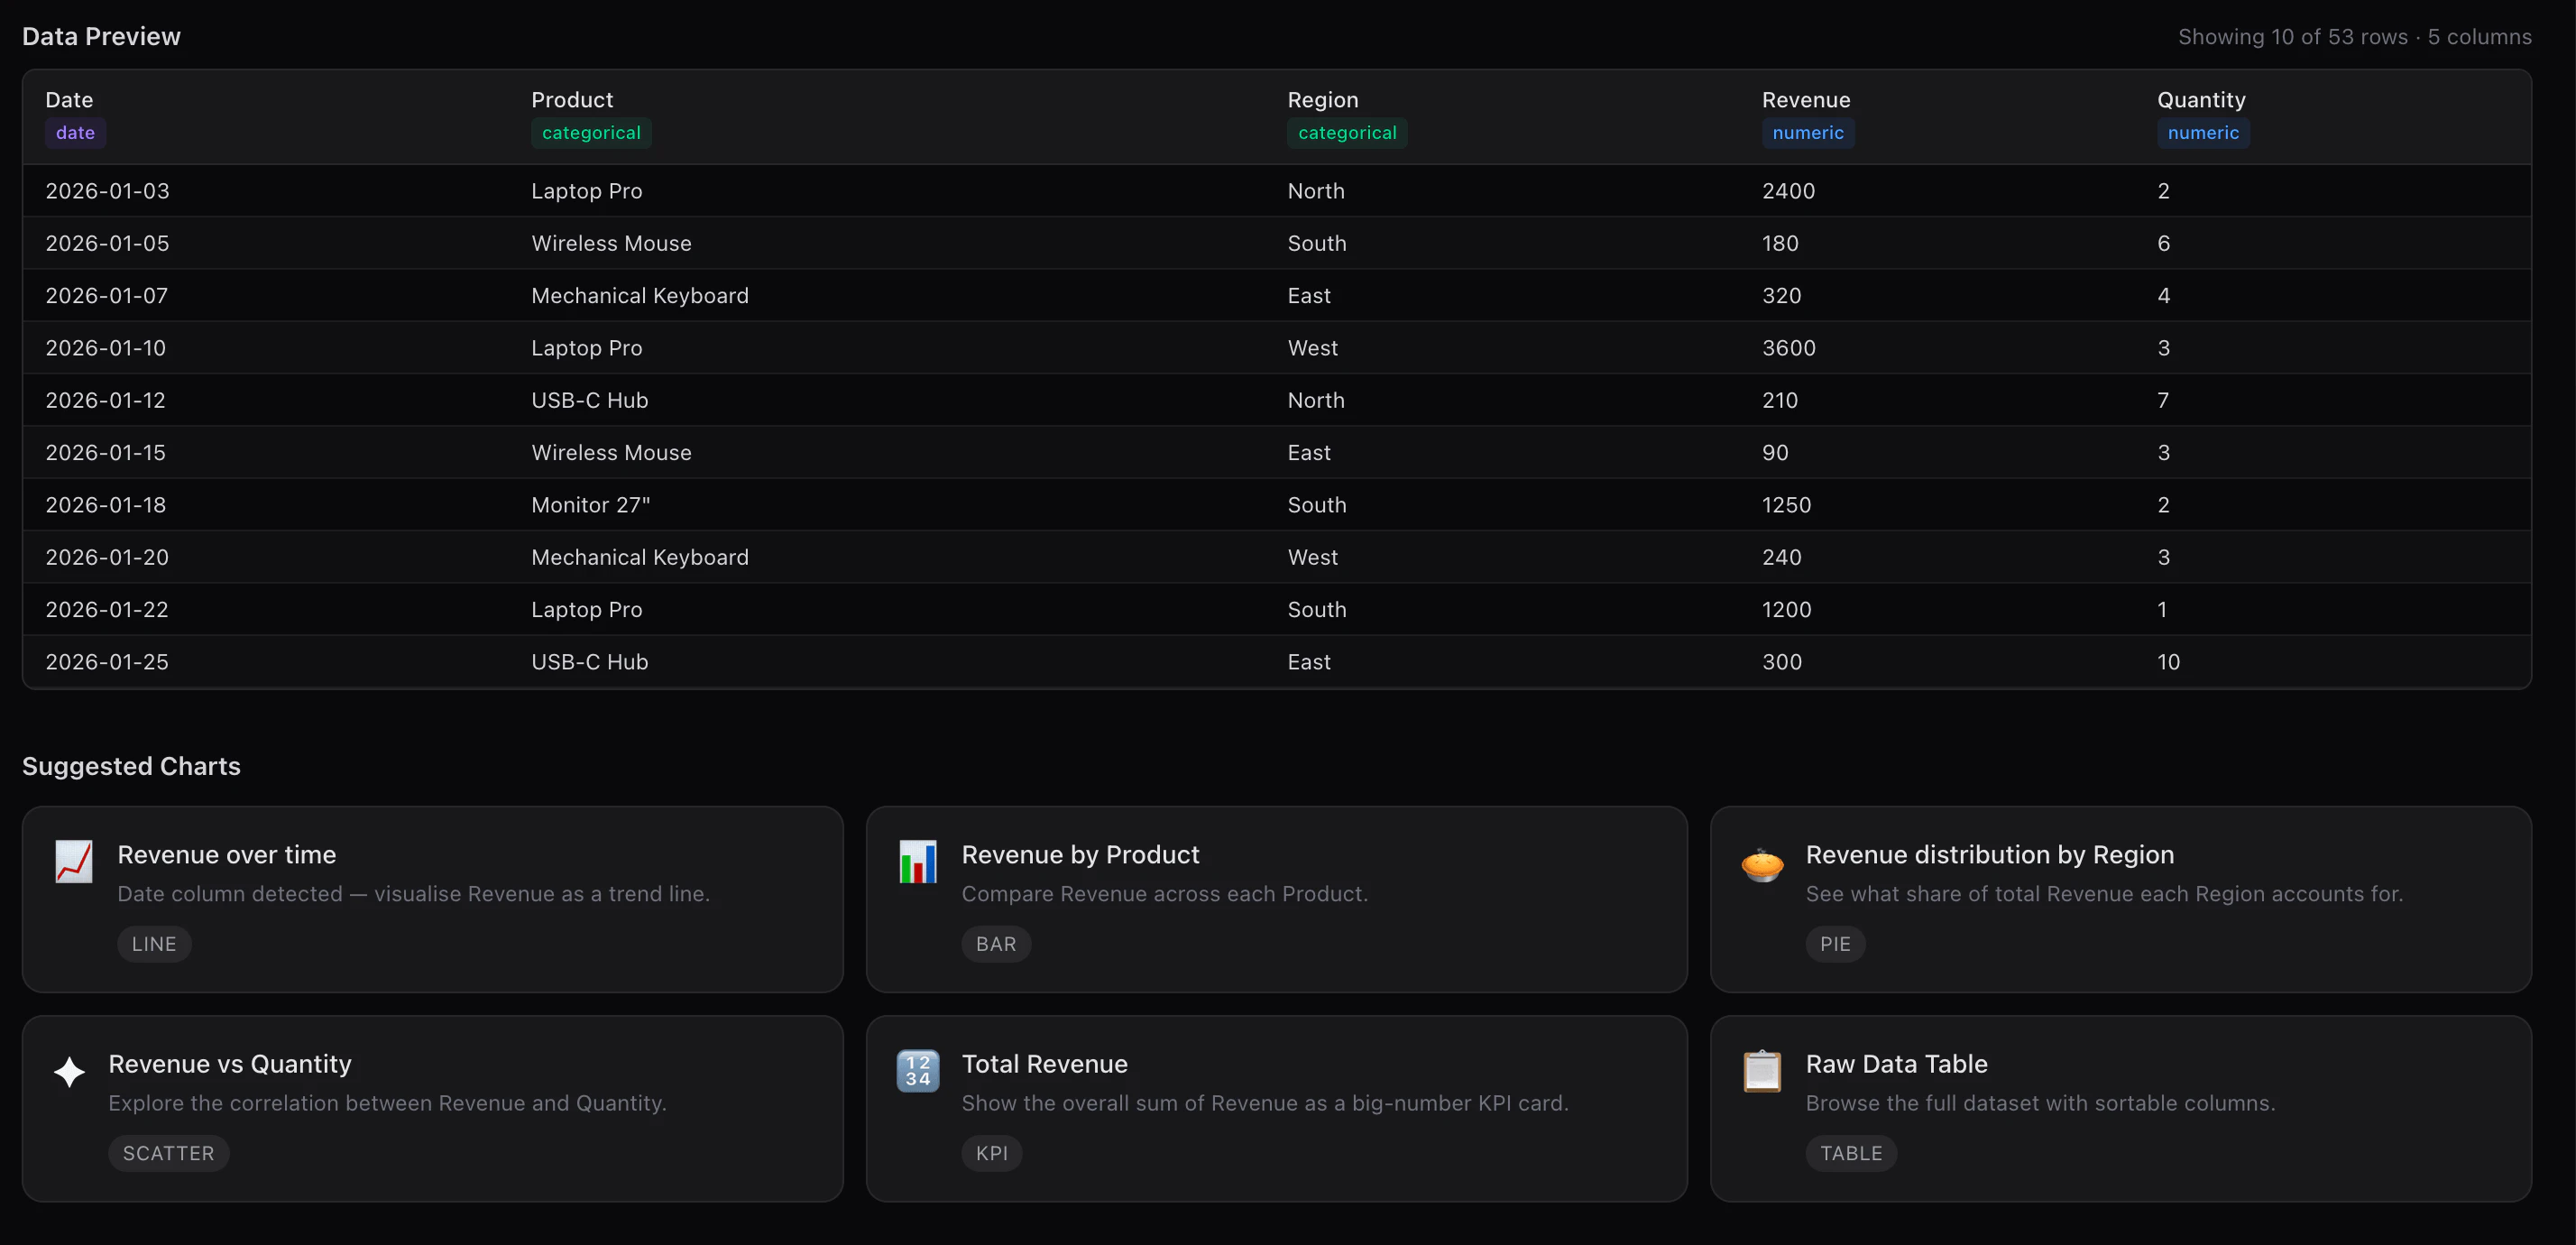
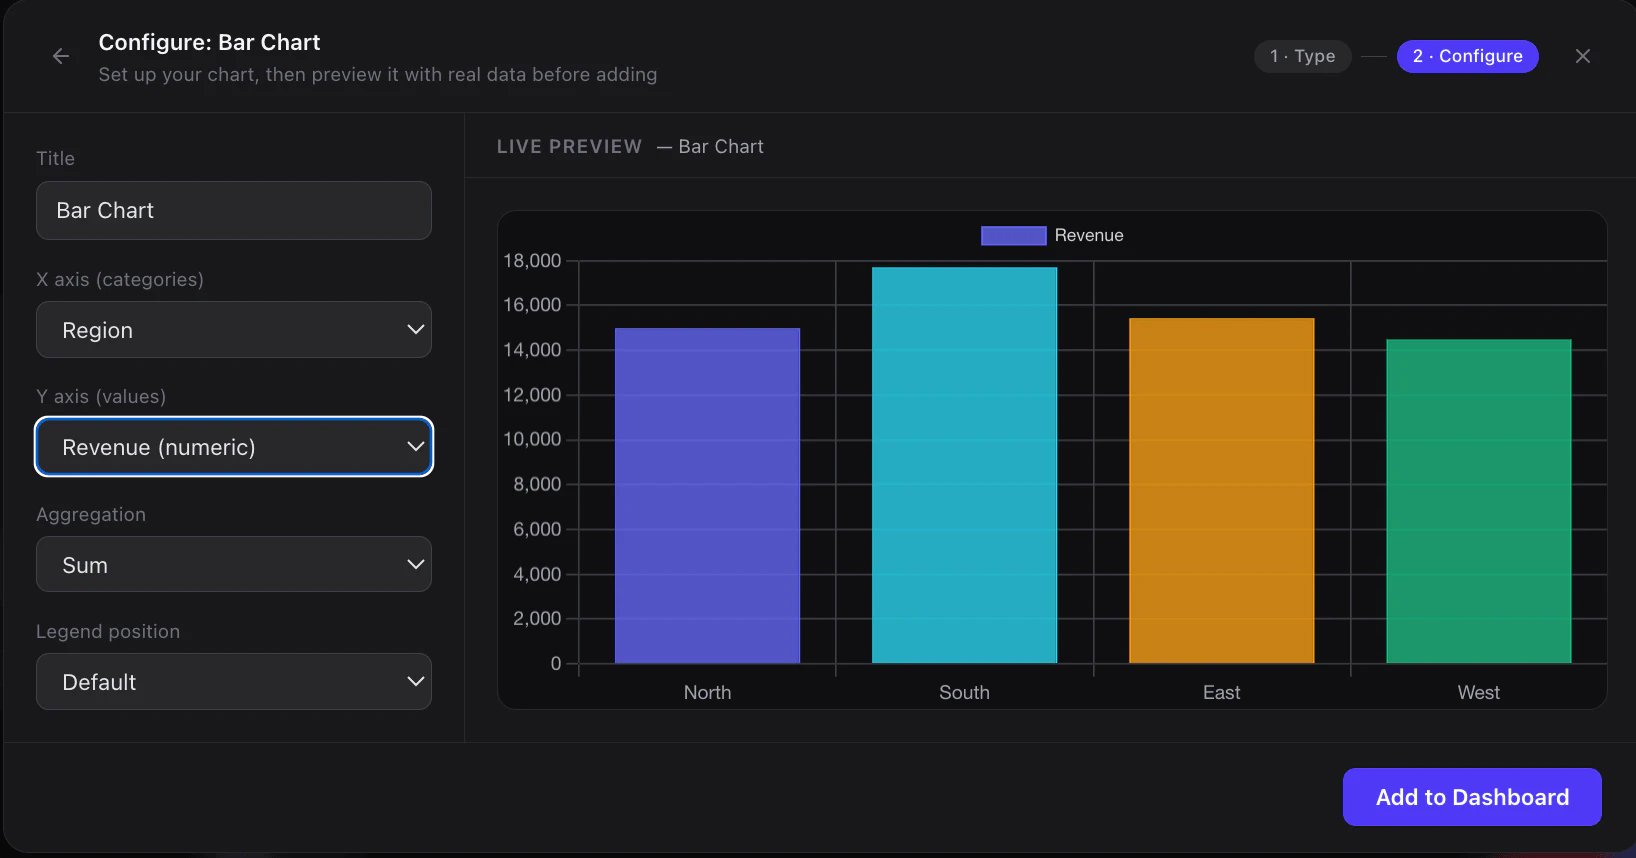
Instantly build charts and dashboards from CSV/Excel files without code.
- Drag-and-drop chart builder
- Local browser processing
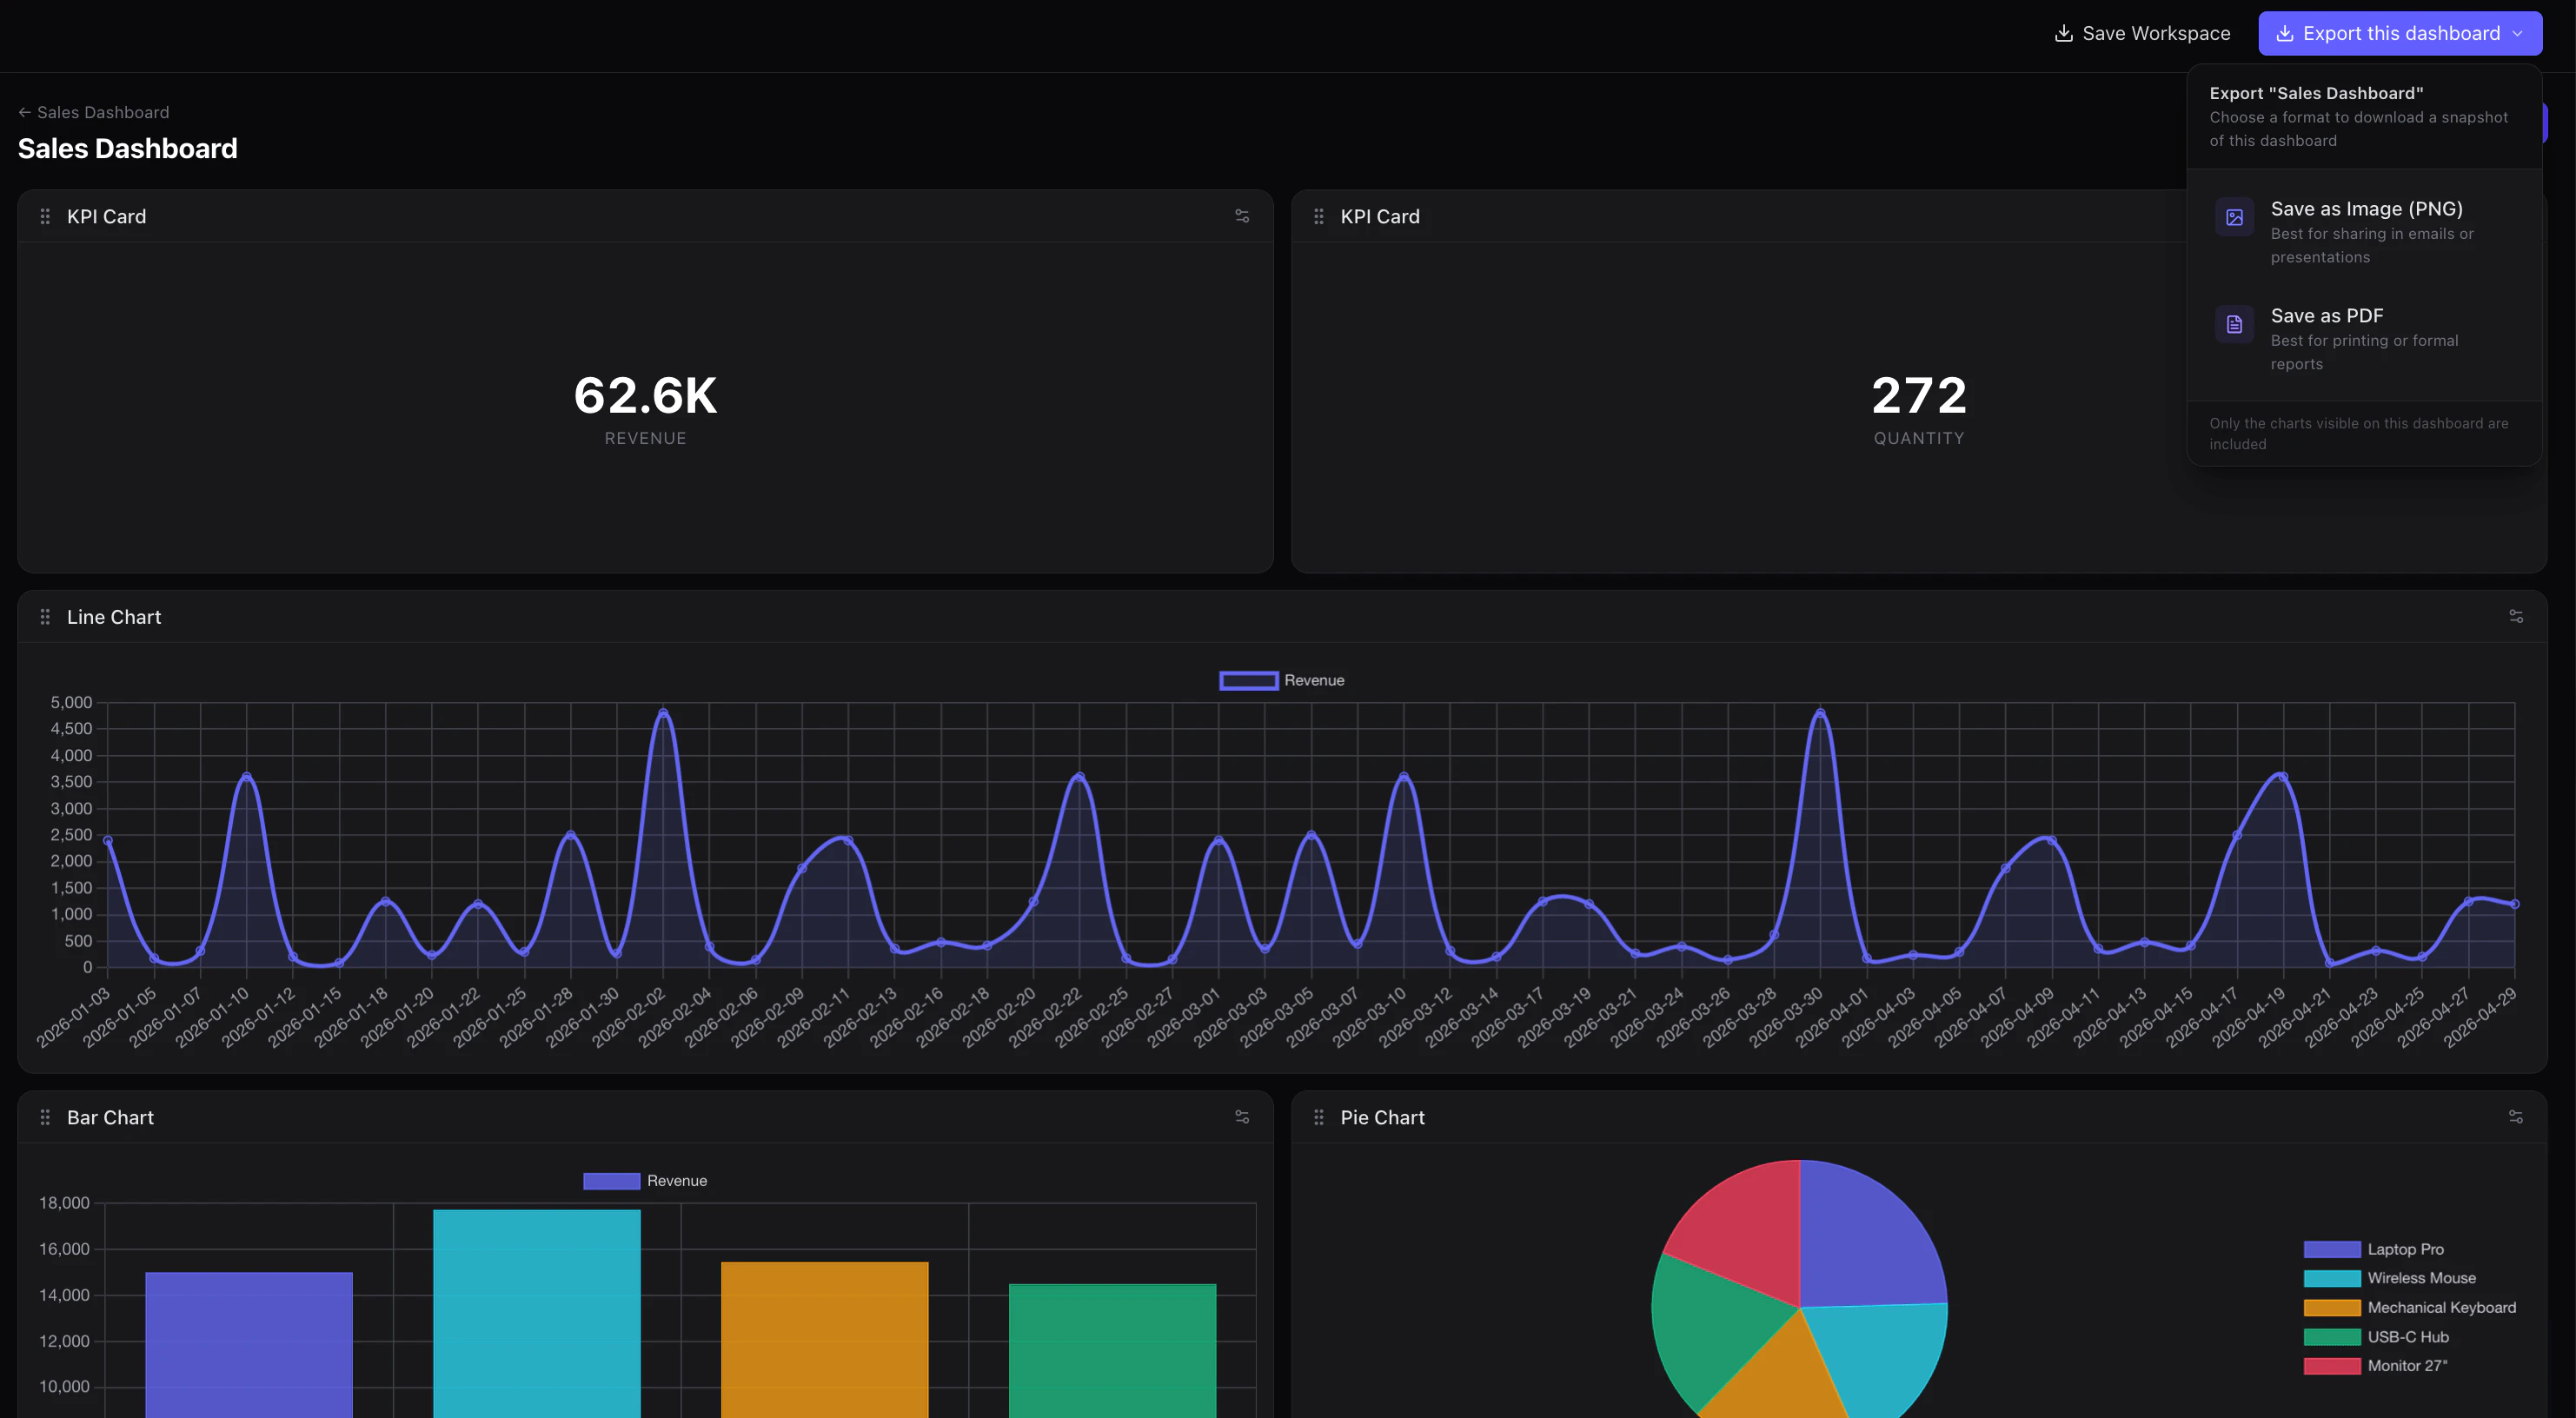
- PDF/PNG export
In their own words
Turn your spreadsheets into dashboards — instantly
Upload a CSV or Excel file. Build charts, tables, and reports with drag and drop. Free forever. No account needed.
Upload your CSV or Excel file and instantly build charts, dashboards, and reports. 100% free, no account needed, runs in your browser.
Commercial cues
Model
free_only
Free tier
Yes
Trial
No
Operator context
Team
Indie / lean
Founded
May 2026
Platform
Web app
Audience
General
Builder Strategy
- Strategy Type
- Niche Specialist
- Stage
- Bootstrapped Lean
- Effort
- Solo Buildable
About Data to Visuals Expand
Turns spreadsheets into interactive dashboards instantly, no code or signup needed.